Aim for middle of green
This is part two of three segments on my current focus to break 80. Our current three focus areas are:
1) Hit more fairways 2) Aim for the middle of the green 3) Go for the two putt
At times golf makes sense and then doesn’t. At times we want to focus on alignment and balance, but then not forget about feel and being “centered”. There is the analytical side of golf, and then there is the unsystemic and almost spiritual side of golf.
It’s time to look deep into numbers and break a common swing-thought.
Data
Today, we are going to break down why we need to ditch pin-seeking and instead just aim for the middle of the green. Some of this is data driven and some of this is based on feel. We are going to look into a few aspects of this argument to give us the best chance of coming away with that par.
Armed with the right data and insight, hopefully we can start to shoot low.
Putting
How likely are you to make the putt?
Looking at PGA Tour data from 2019, I figured out how likely tour pros can hole putts. I’ll dive into that data and analysis in a later post; for now, let’s look at some key stats, and compare how that relates to our chances of making the same putt.
Tour professionals make percentages at different distances1:
- Inside 5’ - 96%
- 5’ to 10’ - 56%
- 10’ to 15’ - 30%
- 15’ to 20’ - 18%
- 20’ to 25’ - 12%
This data represents putting averages from the best 200 players in the world, and yet a 10’ putt only has a one in two chance of going in. I would bet that our averages are significantly lower than these numbers. I don’t have hard numbers, but I bet I make only 75% of my putts inside 5’.
Take a moment to ponder on what these averages at different distances could be for you.
Up-and-down
How likely are you to make a birdie?
Once again, I pulled a bunch of data from 2019 PGA Tour professionals, which will also be written up in a separate post and analysis. For now, let’s look at the summary data:
Tour professionals made birdie percentage by shot distance1:
- < 125yd - 23%
- 125yd to 150yd - 19%
- 150yd to 175yd - 15.29%
- 175yd to 200yd - 15.04%
At 125 yards, a tour pro is only going to get up and down one out of every four attempts. This is likely due to the dispersion of shots relative to the location of the pin.
Take a look at this data measuring average distance (feet) to pin after approach by approach distance1:
- 50yd to 75yd - 16ft.
- 75yd to 100yd - 17ft.
- 100yd to 125yd - 20ft.
- 125 to 150yd - 23ft.
- 150yd to 175yd - 27ft.
- 175yd to 200yd - 33ft.
Between 50 and 100 yards, a tour pro on average will hit their approach to 16-17 feet from the pin.
Green sizes and pin location
There is one final area we need to look at, and this should bring everything together - what do golf course greens typically look like?
What is the average green size (front to back, side to side)?
The average American putting green is approximately 4,500 square feet, or 1,500 square yards2. If we assume a rectangular shape (as most greens are either deep or wide), that could roughly put the dimensions of a green at 30 yards by 50 yards.

Image 1. Typical American putting green size and scale
Where are pins located?
The USGA has provided some guidelines for where a pin should be installed on a green3. Included in these guidelines are that
… generally the hole be located at least four paces from any edge of the green.
Rule 16-2
This rule ensures that pins are generally in the middle of the green, although they may be center, right of center, or left of center. This rule effectively shrinks the green a bit smaller than the average stated above, as we shouldn’t expect pins on those outer edges.
A shrunk green based on this rule might look like the following:
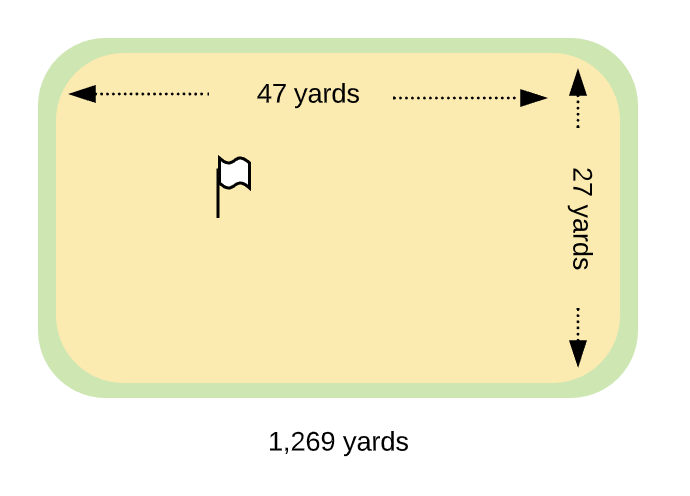
Image 2. Typical American putting green, highlighting portion that is legally allowed to have a pin placed
While not drastically reducing the overall size of the green, it does push the average pin closer to the center, which will be critical in our assessment of where we should be aiming.
Analysis
Now, to make sense of all this data. Let’s start from the green shape and apply the data.
Approach data overlayed on green
If we assume we have a 125 yard approach into a green and are playing on the PGA tour, we are likely to hit the ball somewhere in the blue circle on the following image:
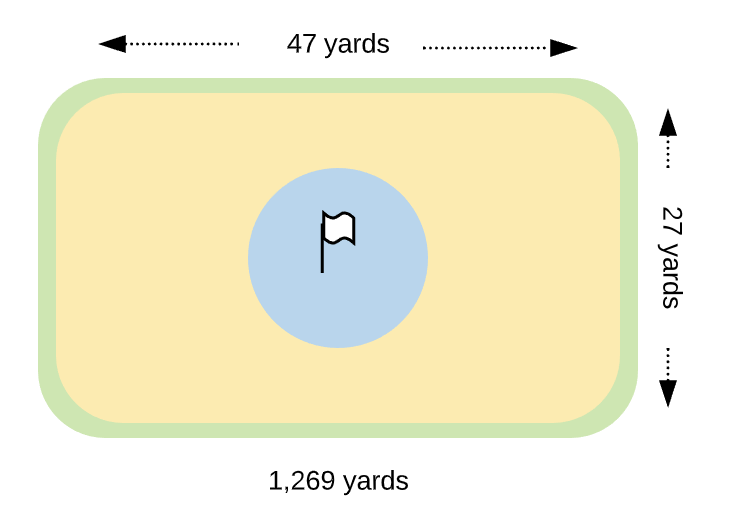
Image 3. Likely drop of 125 yard approach on center pin
The blue circle represents being with 20 feet of the pin, which is the average approach distance based on the data we collected earlier. That circle also represents a tour professional.
Our circle (mid-handicapper) likely looks more like this:
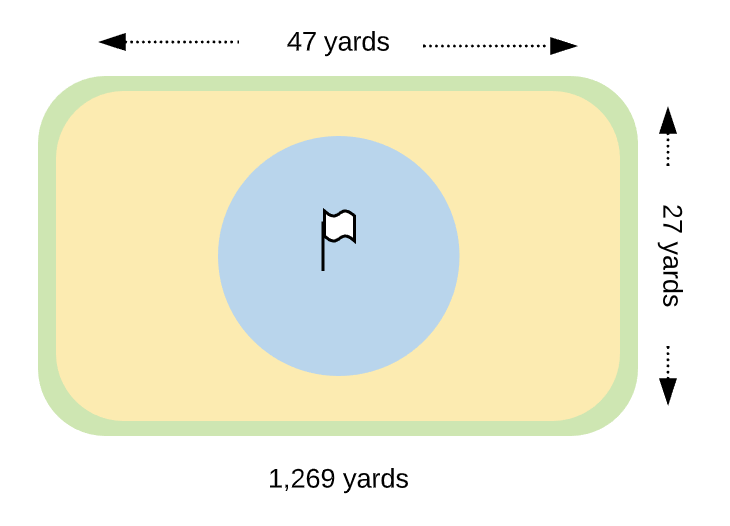
Image 3. Likely drop of 125 yard approach on center pin for a mid-handicapper
Finally, let’s assume that the pin isn’t in the middle, but is actually on an edge of the green. In this case, we will assume it is front left, but it could be on any edge of the green in the yellow (remember, yellow is the recommended ping locations from USGA).
I’ve made the target circle transparent on this image so you can see where this ball might be landing.
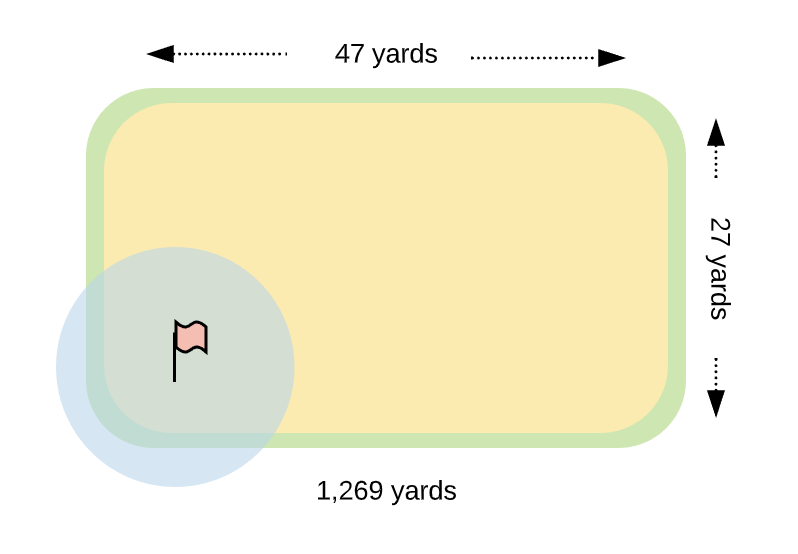
Image 4. Likely drop of 125 yard approach on front left pin for a mid-handicapper
This is a pretty tight pin, but remember that the blue circle represents the average distance - we could be shorter or even longer. There is a significant chance that we are going to end up short or left on this shot and have to trust our short game to get us up-and-down.
Now, say we do end up on the green and are left with a 20 foot putt (which is the tour average distance on that approach shot). What is the probability we make that length of a putt in one stroke? No better than 18%. We have a less than one in five chance of making it.
Now we aren’t a tour professional. Our ball is more likely to land outside the 20’ circle, possibly up to 25’-30’ feet away. That in turn will increase our risk of missing the green entirely, which will force us to be chipping up-and-down instead of going for a two putt.
It’s all about risk and reward, and in the case of going for the pin, the risk significantly out-weighs the reward.
Middle of the green
By focusing on the middle of the green, you reduce the risk of missing your approach and give yourself a higher percentage of two-putting. With your shot being less consistent, you are also occasionally going to have a fortunate miss where your ball ends up closer to the pin and a birdie will be in play. Otherwise, your focus should be on getting on the green and then two-putting.
Let’s take a look back at the diagrams from earlier. If we aren’t striking our irons well and our approach game is struggling, what happens if we focus on the middle of the green instead of going after the pin?
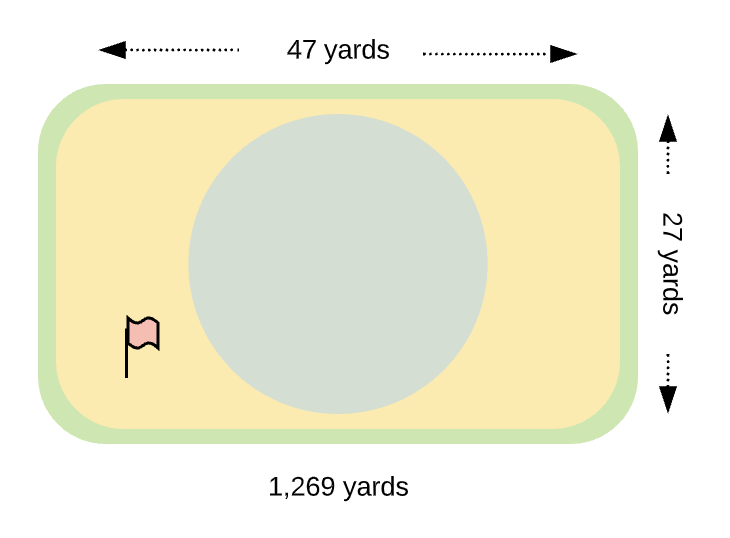
Image 5. Aiming middle of the green with a front-left pin
With this type of approach, we might end up with a 15 foot putt, we might end up with a 55 foot putt. The important thing is that we are putting. Sand, thick rough, bad lies, all of it is taken out of play when we find the green in regulation.
If we can consistently hit greens, then our focus becomes how to lag putt better. As we eliminate more three putts we will drop our scores dramatically.
Conclusion
We looked at three data driven aspects of our golf game: 1) Putting 2) Approach (up-and-down) 3) Green sizes
Taking all this data in, we can see that (at least for now) we are best focusing on getting to the middle of the green. If we can get in the fairway and then get on the green, we will be well on our way to shooting 80.
References
-
Data on PGA Tour professionals pulled from the PGA Stats website: https://www.pgatour.com/stats.html ↩ ↩2 ↩3
-
Average American putting green on a golf course is ~4,500 square feet: https://www.quora.com/Is-there-a-rule-about-the-size-of-a-golf-green ↩
-
USGA guidelines on pin placement: https://www.usga.org/RulesFAQ/rules_answer.asp?FAQidx=143&Rule=16 ↩